Challenge
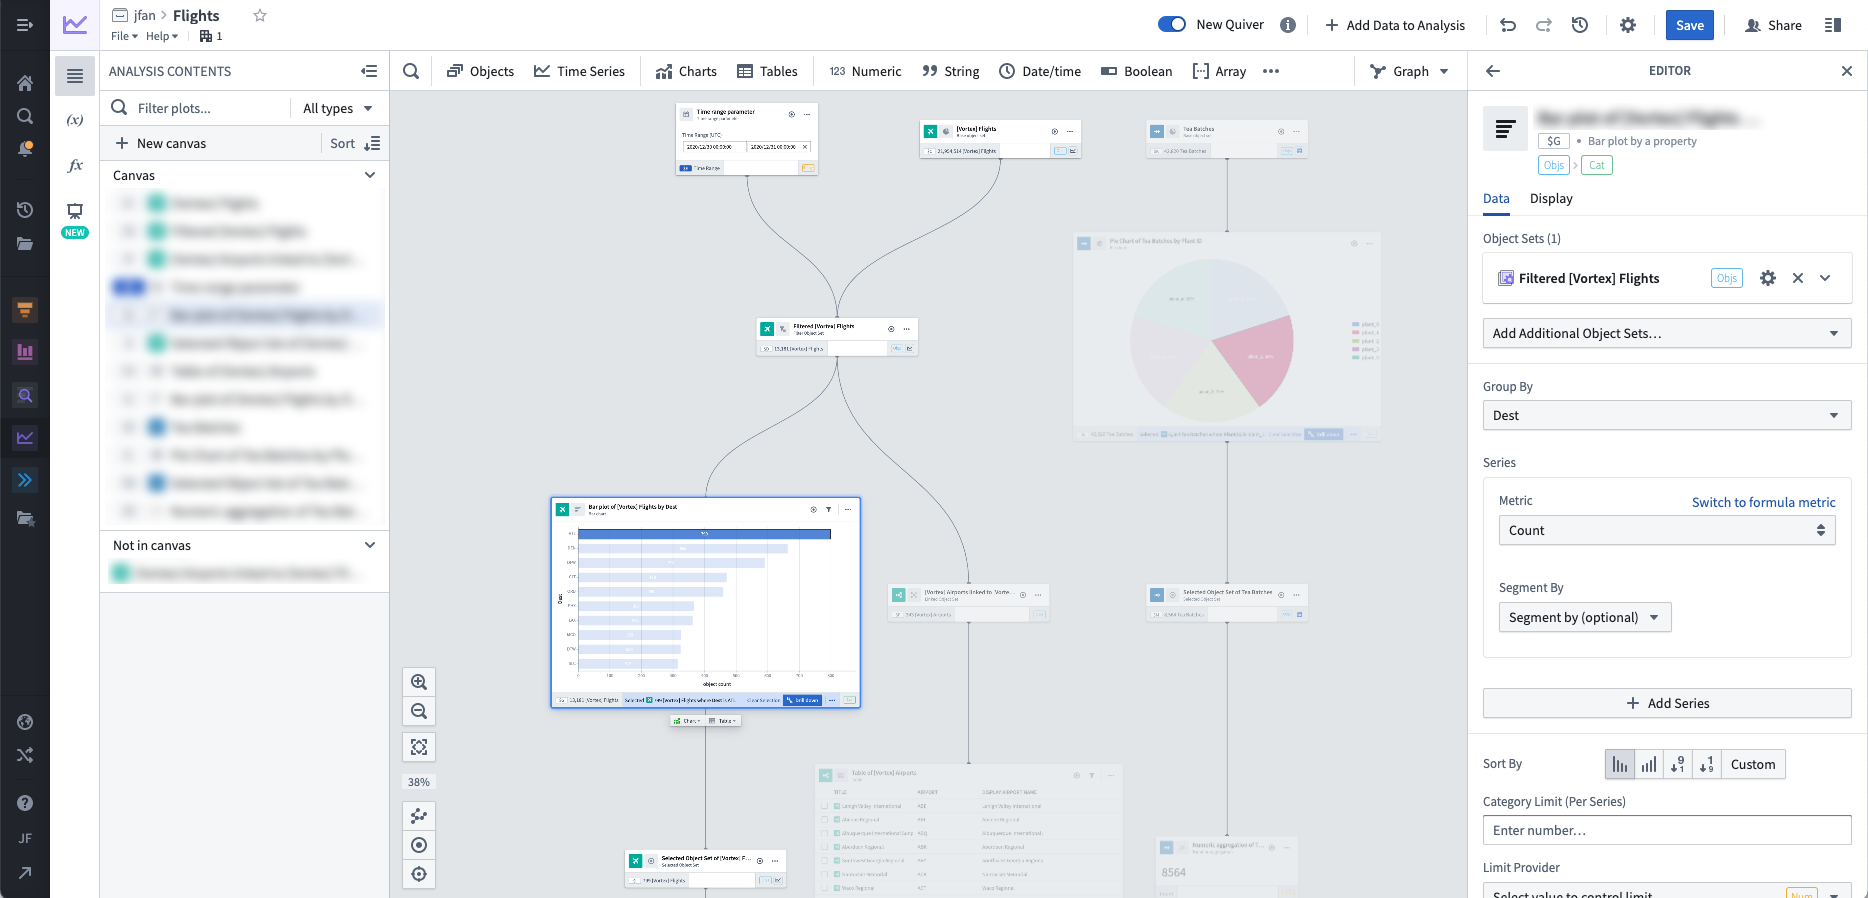
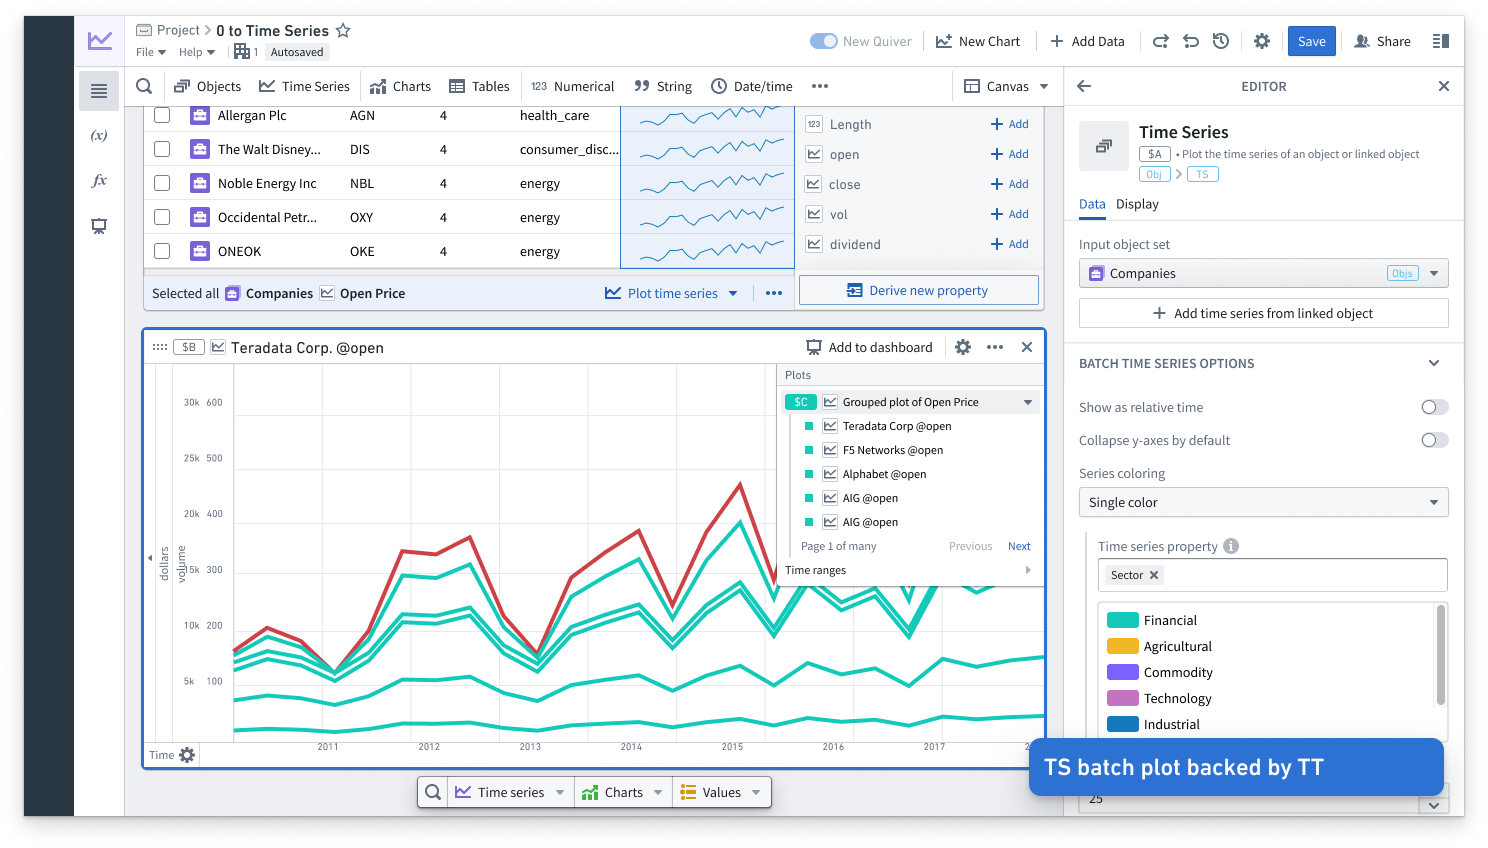
Quiver is Palantir’s visual programming analytical tool, designed to allow users to easily create dashboards and analyses with various input data formats, especially time series. It originally developed as two separate apps: one developed specifically by end-users to analyze and monitor time series data from high-scale sensors, and one dashboard creation tool that allowed users to leverage high-quality, organization approved datasets (defined as “objects” in a client’s data ontology) to perform calculations and create data visualizations, all in a point-and-click interface that required minimal to no coding.
Outcome
As a core member of product team, I worked on an extensive product roadmap to reimagine how the disparate product features of quantitative time series analysis and point-and-click visual analysis could be combined into a single visual programming tool that allowed business analysts to easily start creating valuable artifacts from data assets on a client’s Foundry instance. The changes involved performing extensive user research on the variety of use cases, decomposing and synthesizing disparate use cases into a singular vision, and proposing a series of high-lift product changes that completely shifted the position of the app in Foundry’s ecosystem to be generalized to cover a wider variety of use cases than its more specific origins.