About this project
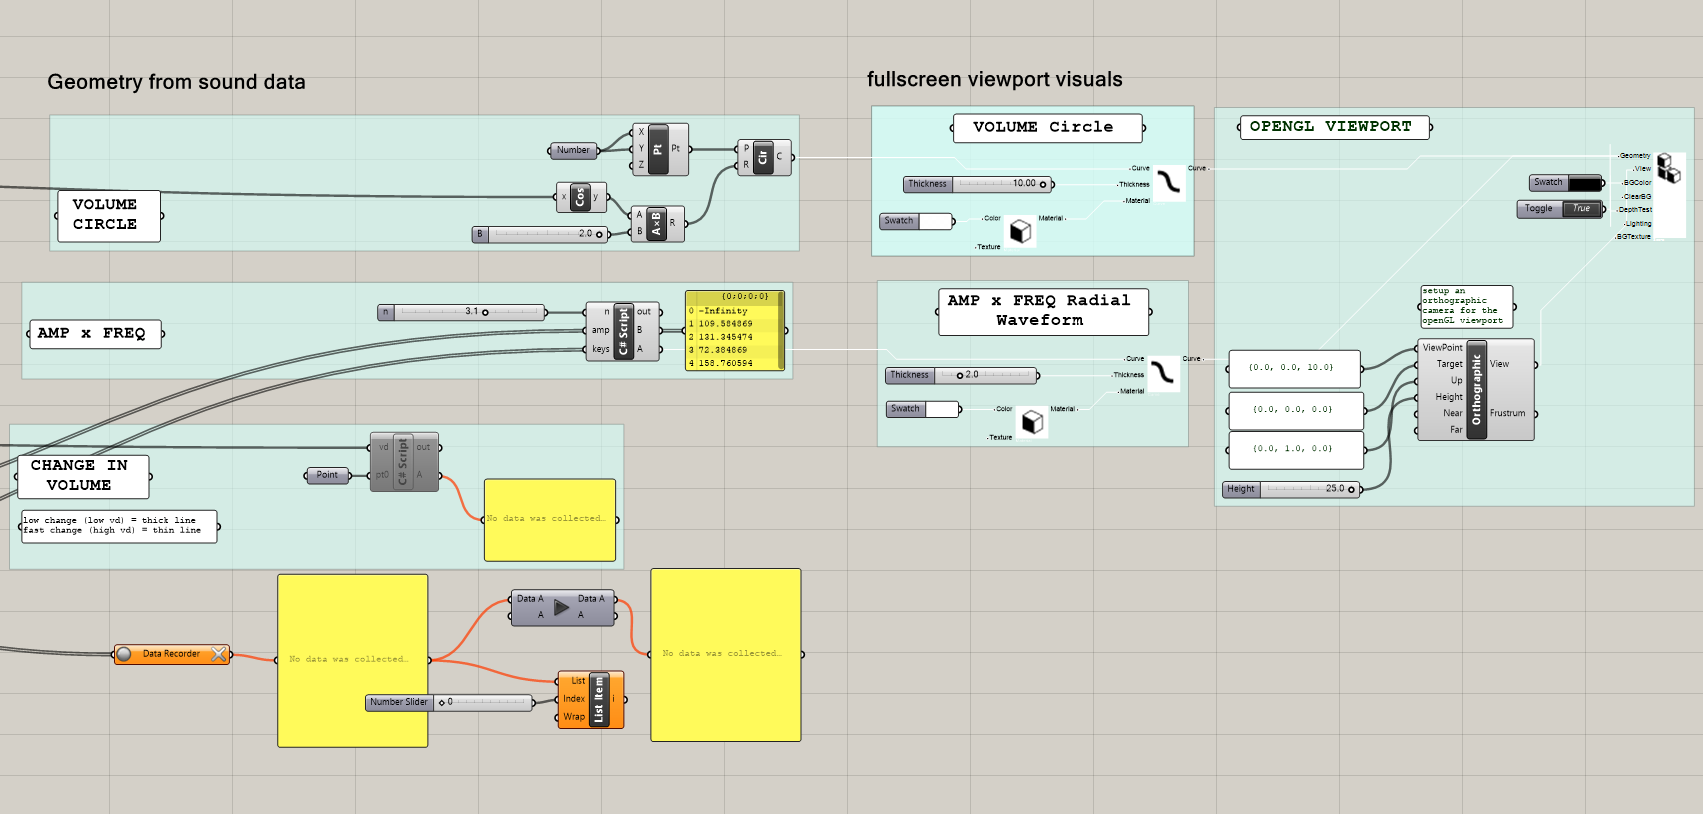
We focused our visualization as a radial projection that was parameterized around frequency, rhythm, and volume. While researching the visualization of signal frequencies, we explored translating the sine waves generated by sound frequencies into a radial shape and modulating these parameters: - Intensity of signal frequency (proxy for volume) -> length of the loops (high intensities had a greater distance from the origin) - Beats per second (adjusted by Grasshopper parameter) -> rotation around the circle (cycle count) The radial design had the effect of creating dense, bright visualizations for short, staccato sounds. Louder, more intense sounds fell much farther from the origin. Most interestingly for us, depending on the cycles per second, elaborate shapes could be formed from the displacement of the lines, including 6-point and 12-point stars. With simpler input signals, such as single piano keys or chords, the shapes form orderly, neat structures. With more stochastic, chaotic input signals such as human speech, the cycles break and collapse into jagged forms. As a real time sound visualization, we also included a metronome in the form of a circle that expands based on a straightforward sine function of time. The circle helps provide a standardized "rhythm" to the visualization that exists separately from the input signals.
Grasshopper Visualization
Using Firefly and some custom Grasshopper plugins provided by our professor, we modified the frequency/amplitude curves and created a circular metronome using the cosine of time.
Version 1. Infinite Mirror
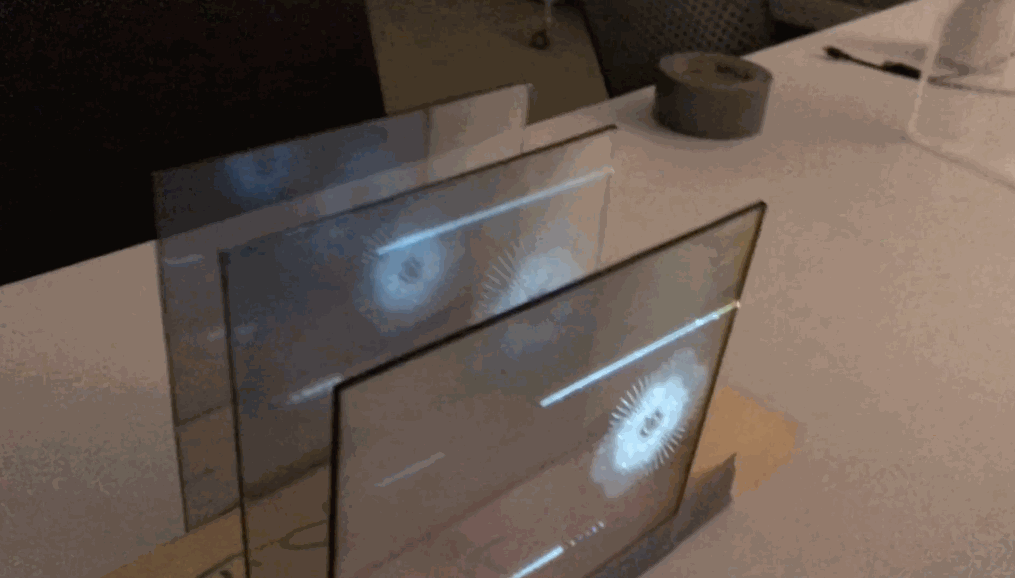
We had initially started by projecting on an acrylic box with fiber optic threads, but quickly realized that the complexity of our projection required a simpler surface. In our second exploration, we used a row of acrylic mirrors to create an infinite visualization of the stars that represented volume and frequency. Such display allowed us to understand sound as a continuum that overlapped as notes continued to flow.
Version 2. Immersive Constellation
By changing the angles of the infinite acrylic mirrors, we explored the visualization of the bouncing and overlapping of sound waves in surfaces while maintaining a focus on the frequency and volume created by the polyhedral stars.
Version 3. Circular Tiers
For our last model, we separated the projection onto 3 separate solid black circles to most clearly discretize the densities at different frequencies. By physically separating the circles, the densities across the three radii is most evident.