Data Vis

Data Autobiography

Data visualization of the volume of words I have written for creative pursuit, academia, and personal journaling over my lifetime

Context

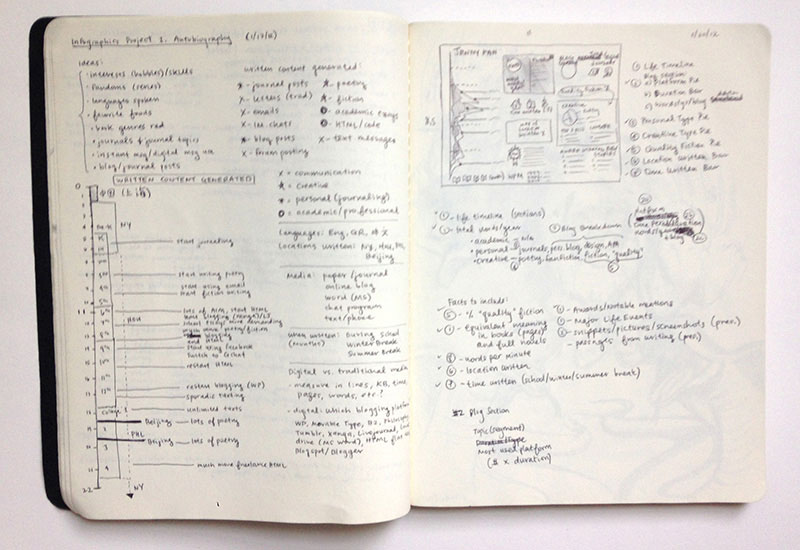
Create an autobiographical infographic based on data.

Impact

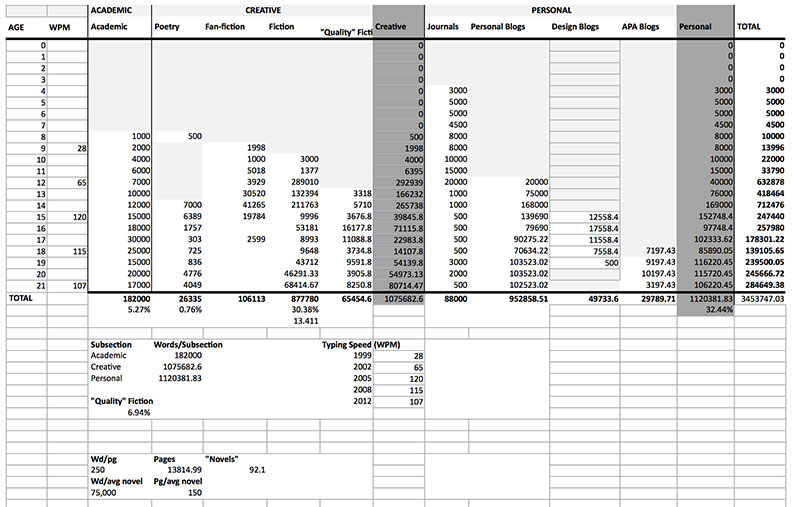
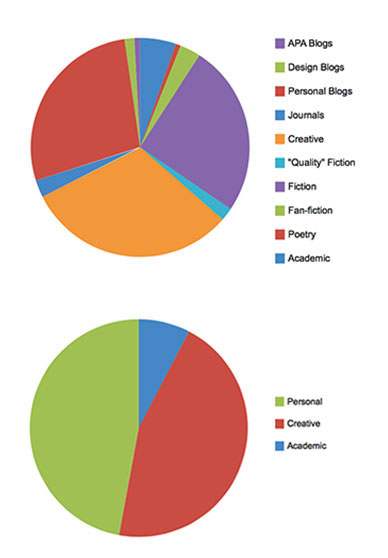
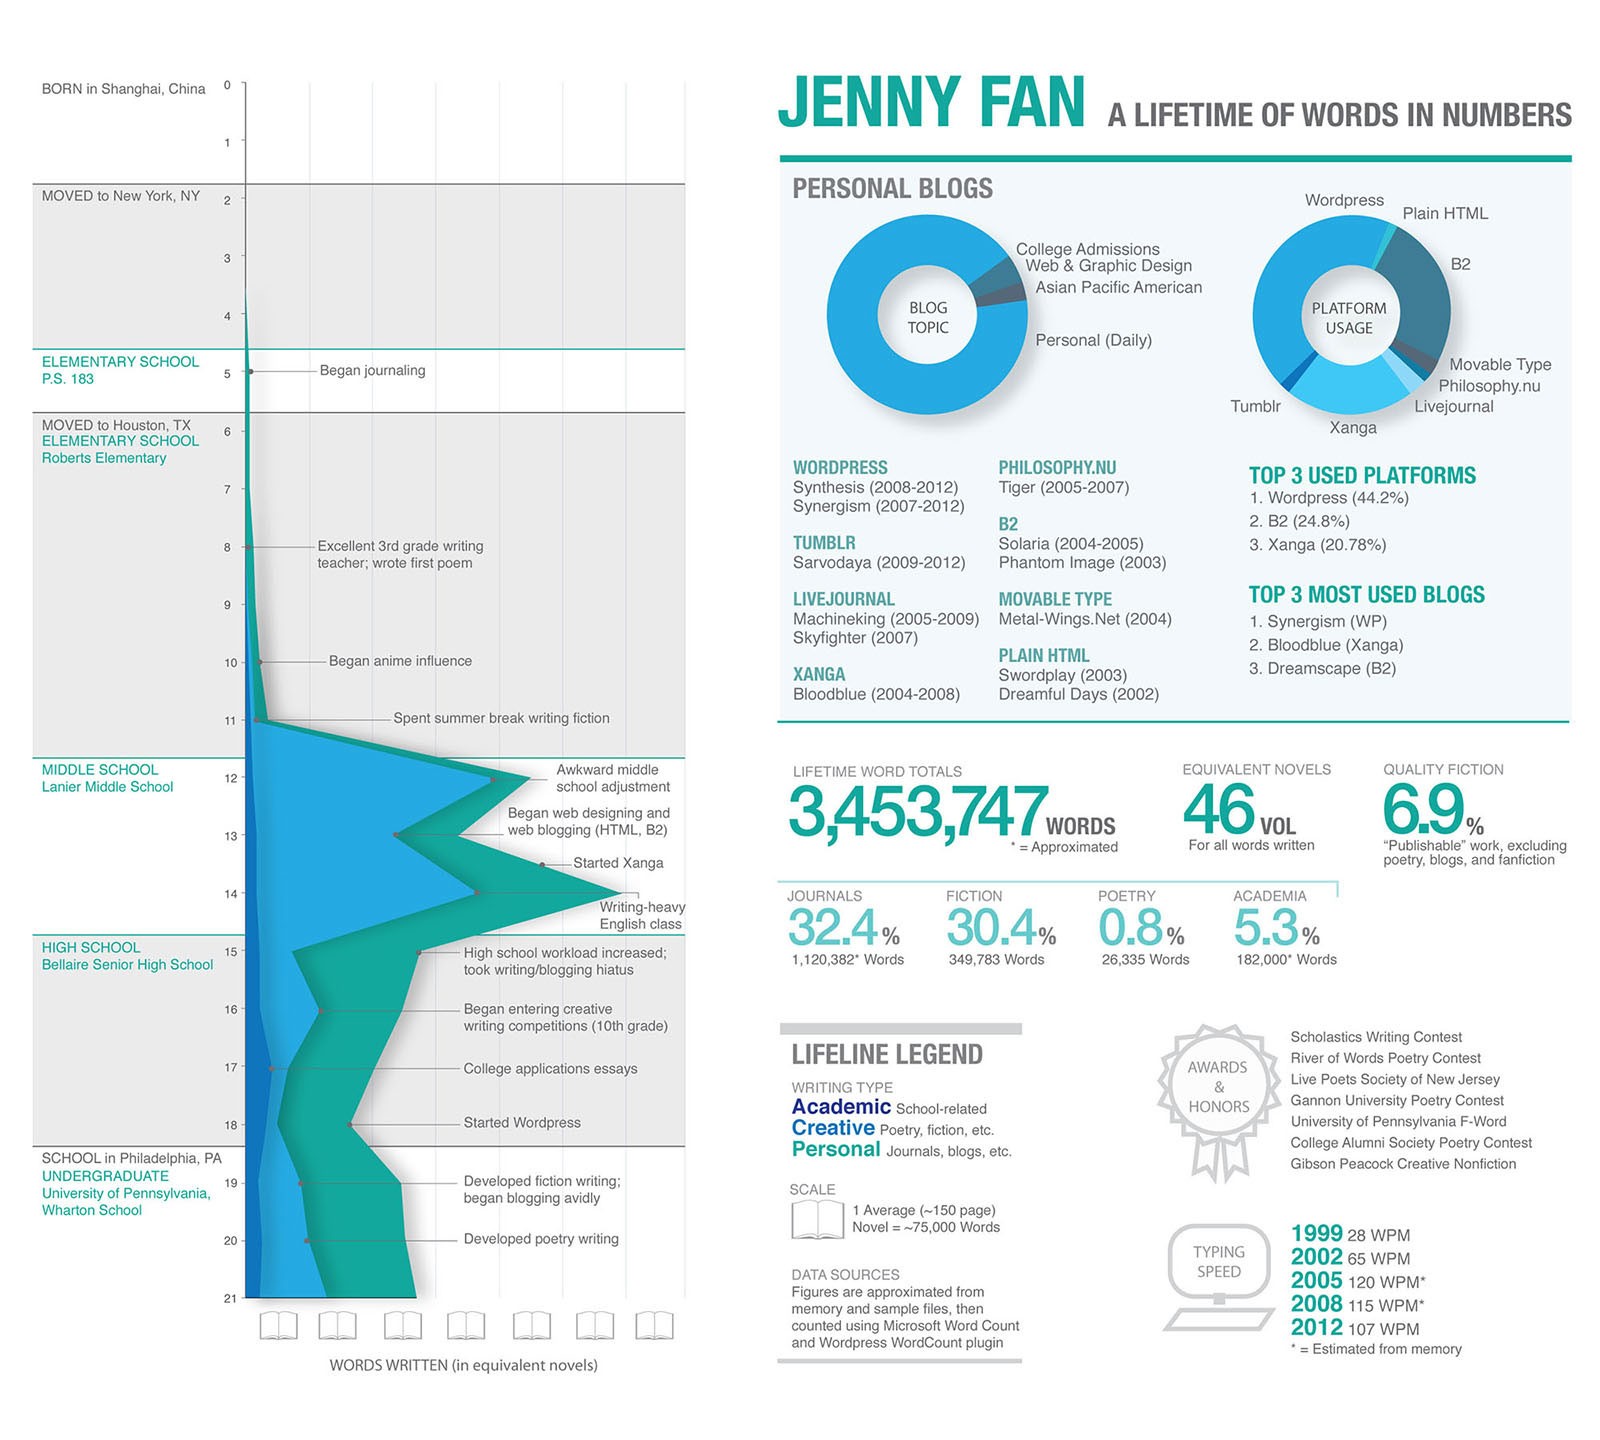
My final project was a flat image infographic, Jenny Fan: A Lifetime of Words in Numbers. It is a visual portrayal of all of the words I've written in my life for school, creative writing, and personal writing, inspired by the navel-gazing work of Nick Felton. I wanted to represent myself using a measurement that is close to my development as a person, and writing has been one of the consistent trends throughout my life that has evolved in nature through the years.


This was a very free-form project, so I had the freedom to set my own scope and limitations for what data I wanted to capture and represent. Luckily for me, I keep meticulous track of all creative writing pieces I’ve ever done. MS Word’s Word Count option made it easy for me to sum up word count totals throughout the years for offline documents. For the blogs I’ve kept over the years (including now-defunct ones), I used an online web tool to find the word count from XML files for WordPress-based blogs. Xanga was difficult to scrape, so I used an average word count estimate across my posts. Though the final result is a little embarrassing, it is entirely honest, as the best biographies are :)

Acquire and Prepare Data

I prototyped in Excel in order to understand my data before structuring the layout of the graphic.

Explore, Form, and Validate Hypotheses

The nuance of using word count writing data to represent my autobiography was to explore how the volume and topic of my writing changed over time. The axes were easy to determine (x: time, y: word count), and separated the categories into writing genres. I further categorized the time chunks into schooling periods, which closely represented the “phases” of my life and how I allocated my time.

Represent and Refine Findings

I originally thought about creating an interactive piece with some rollover content, but had to scope down due to time restrictions. The final layout is a simple two-column, made semi-intentionally convenient to fold in half like a book. I chose to stick to a simple color scheme and represent the graphics like a dashboard, with minimal imagery and some iconography.