Data Vis / Github

Aging in Place

Data vis showing the efficacy of state investments in home & community-based programs on the elderly

Context

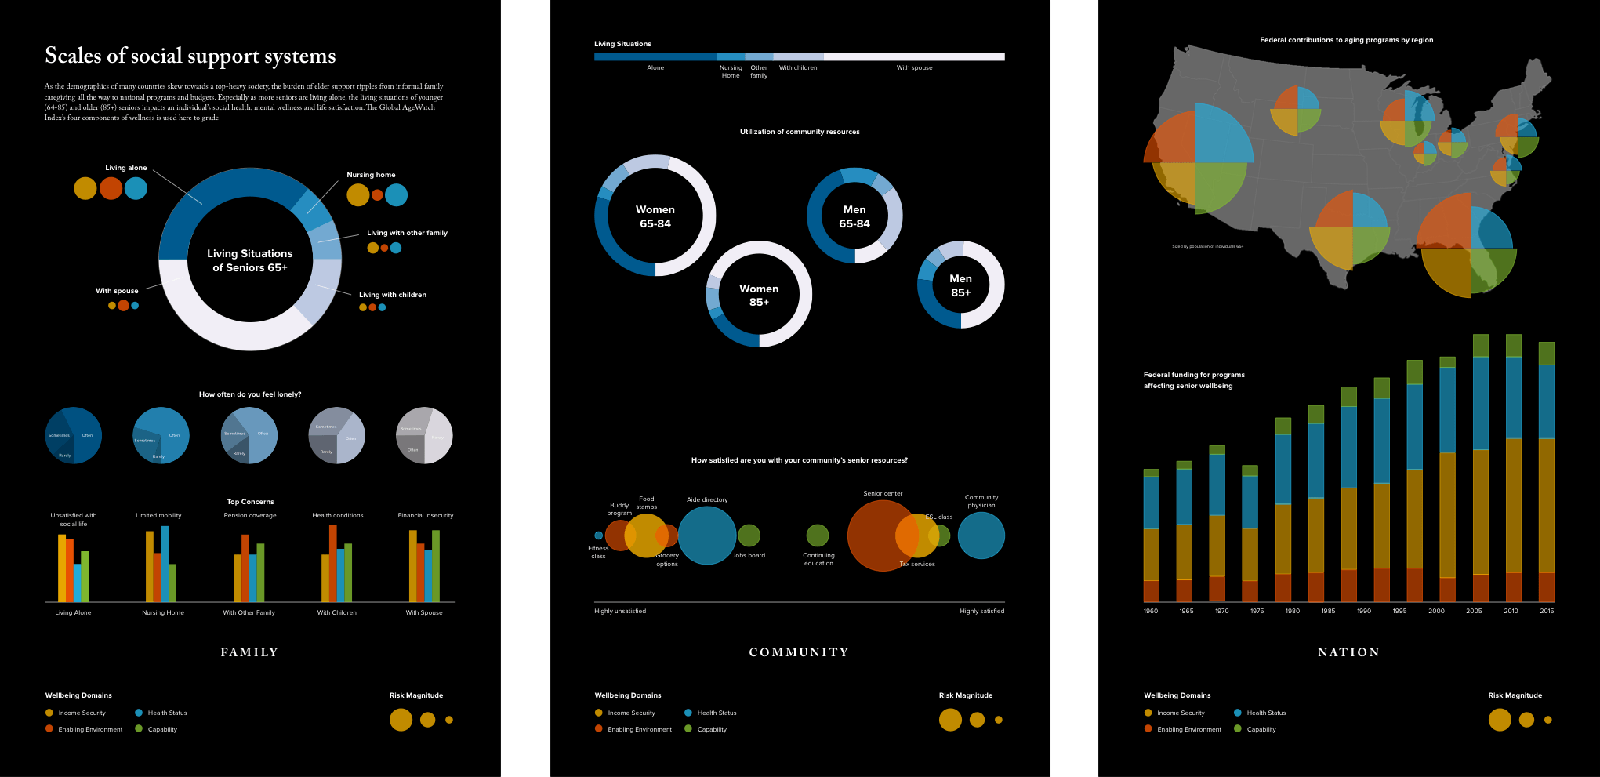
Visualize the impacts of a healthcare metric across three scales using available data sources, taking care to show the interconnections between the scales and hint at possible interventions to address the exposed problems. I chose to focus the problem on loneliness and difficulty aging in place for the elderly, who often do not want to go to nursing homes but lack governmental assistance for aging-in-place programs.

Impact

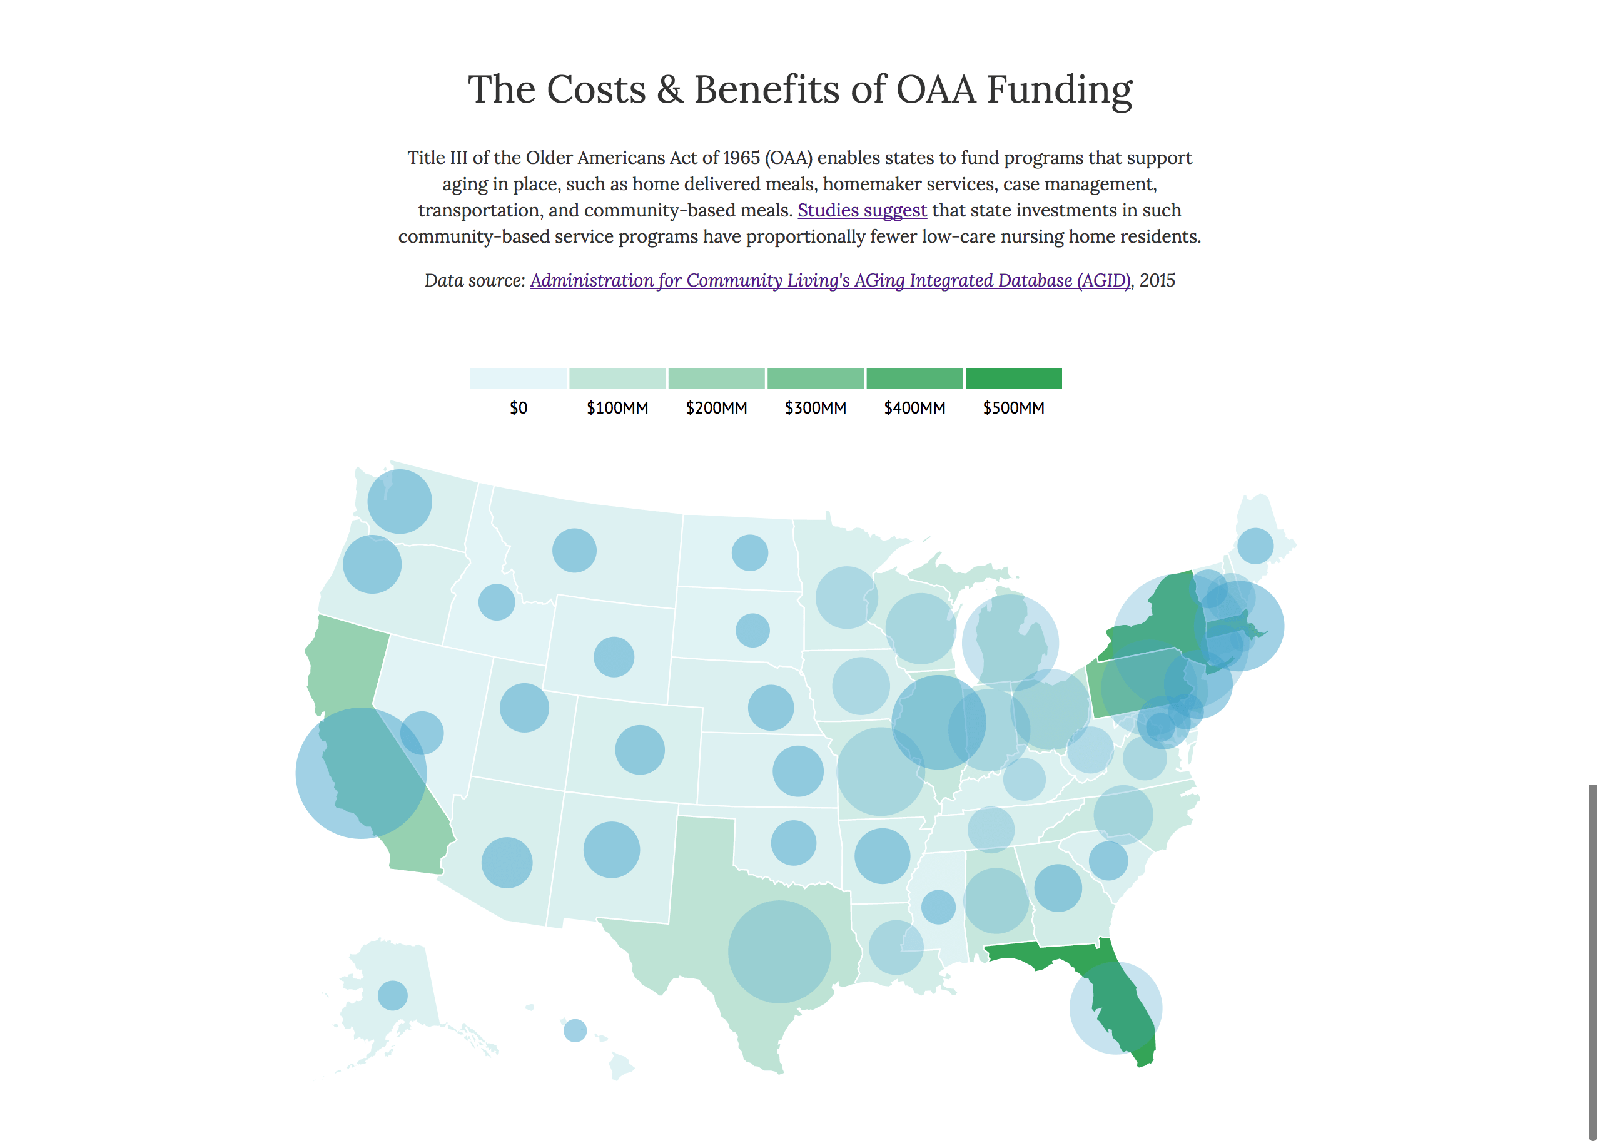
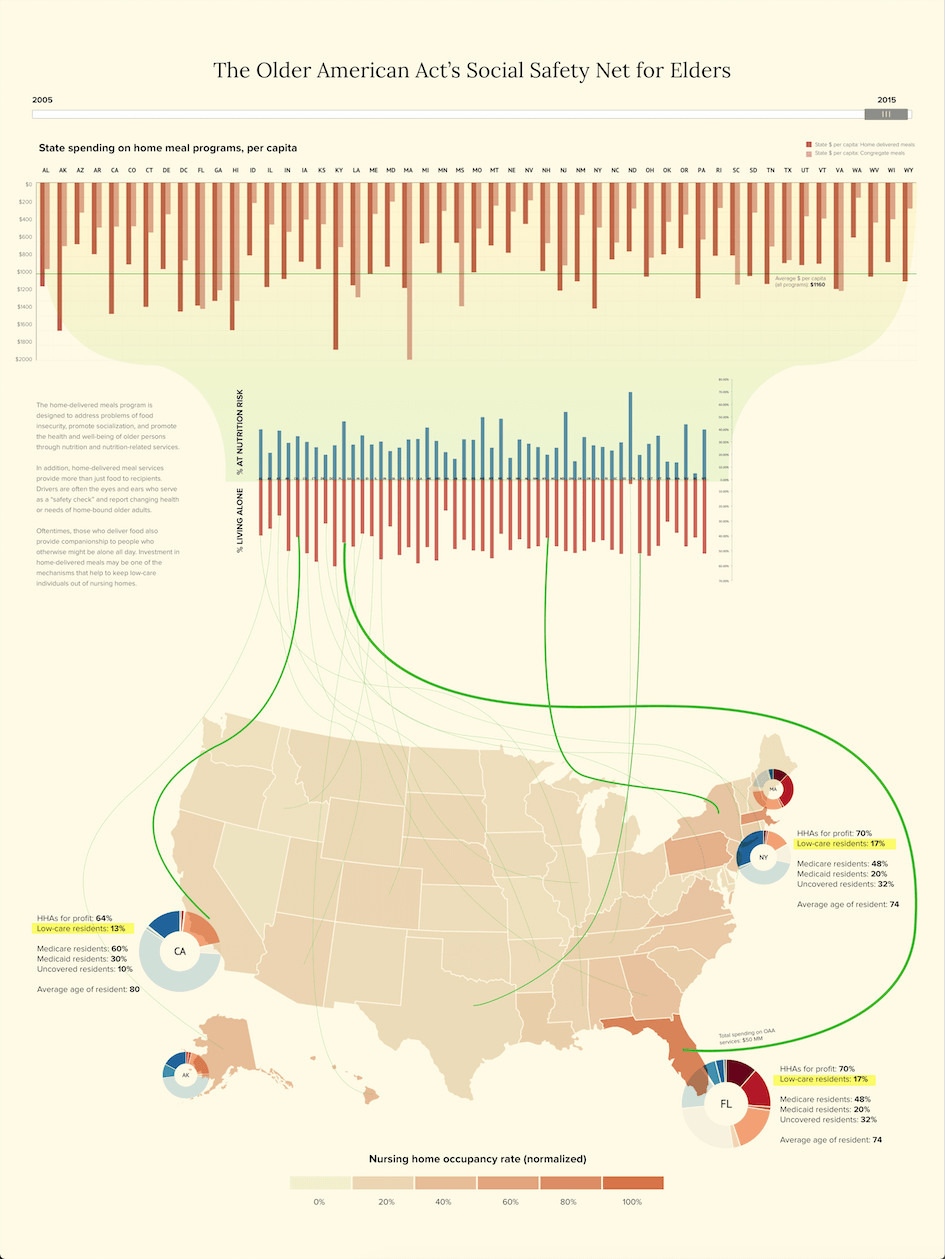
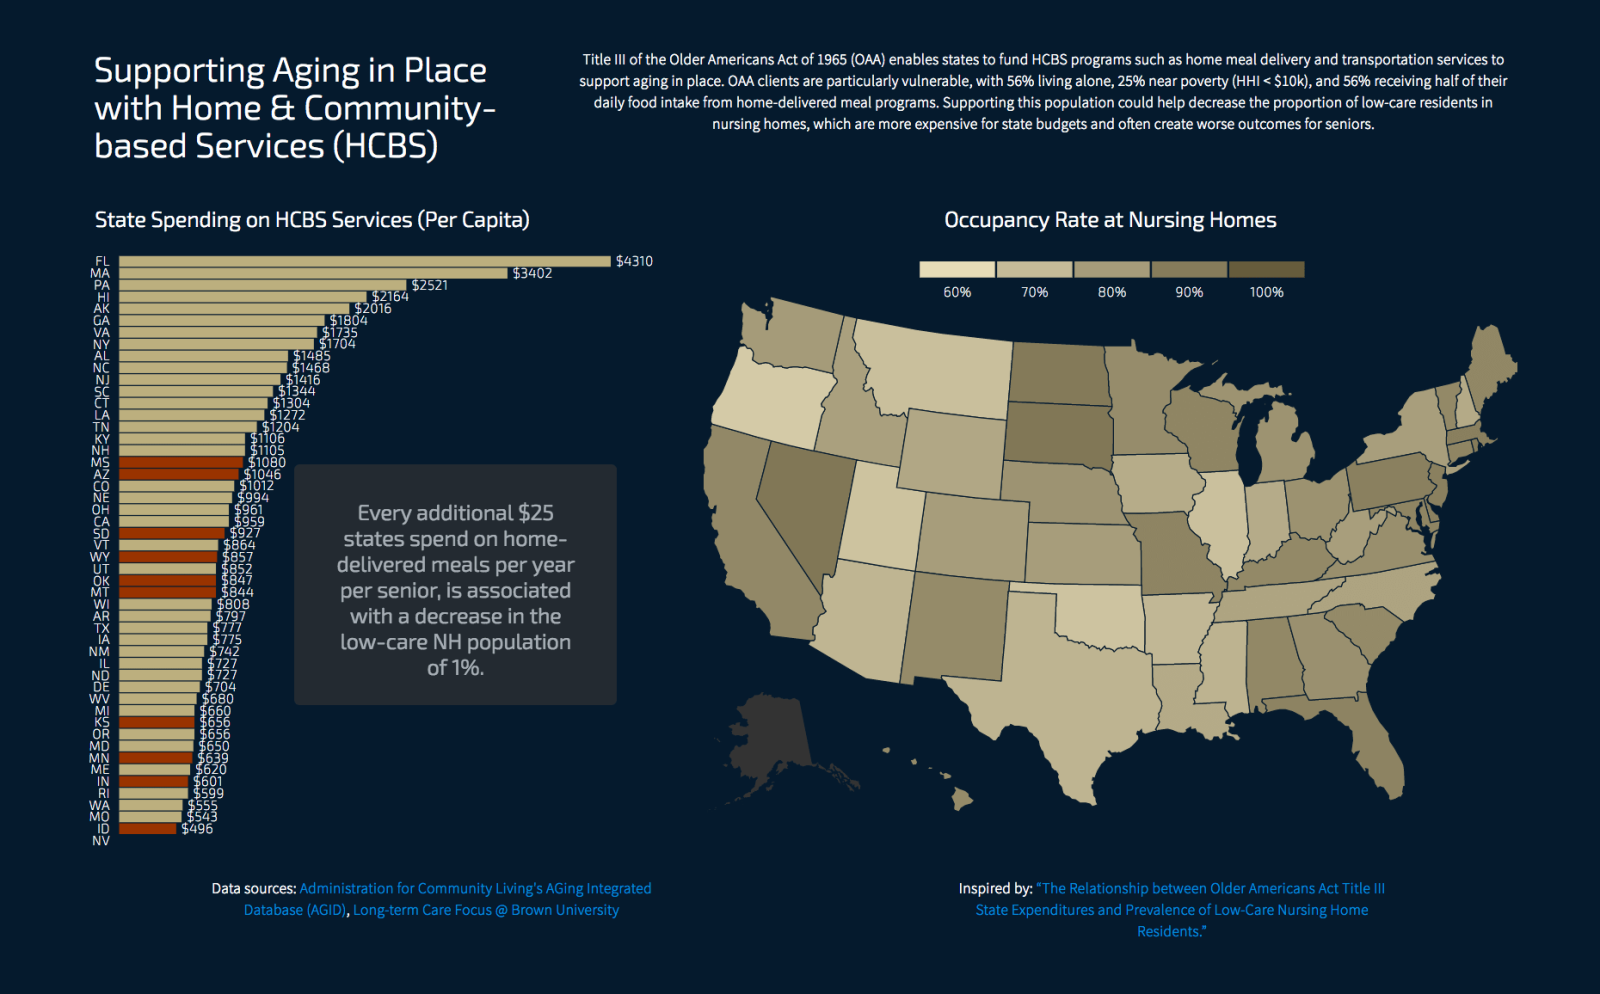
Through much iteration, I focused on representing the impacts of Home and Community Based Services (such as home meal delivery and shuttle services) funded by the Older Americans Act of 1965, showing the correlation between increased spending of HCBS and reduction of spending in nursing homes. The final chloropleth shows how funding policies, demographics, and ultimately, nursing home occupancy rates differed across states.


Studio Datavis Assignment: Week 1

For my Design Engineering studio's Data Visualization unit, we were tasked with visualizing a set of aging/healthcare data across three scales. I chose to visualize the impacts of aging alone across individual, community, and national scales. My process began in Sketch, pulling in precedents and creating my aesthetic concepts. Working in Sketch instead of Adobe Illustrator has become surprisingly natural and versatile.

Studio Datavis: Week 1

Without having pulled any actual data, I explored what types of visualizations could be helpful. In hindsight, this process was completely flawed -- I will never attempt to structure the visuals of a visualization without having 95% cleaned data again.

Studio Datavis: Week 2

Jumping from visuals to D3, we were tasked with translating our data into an implementable coded visualization. Sticking with the good ole chloropleth, I overlaid 2 data sets on nursing home expenditures and funding for the Older Americans Act, a program that supports home meal delivery and facilitates aging in place.

Studio Datavis: Week 3

To further increase the sophistication and "density of data" for iterating, I tried to overlay the chloropleth data against both state level funding data and resulting nutrition levels.

Studio Datavis: Week 4 (Final Product)

The final version of my initial investigation into the impact of loneliness among aging Americans evolved to overlay two data sets to answer the question of how funding for home-based care impacted the overall healthcare spending on nursing homes. I wanted to investigate whether increasing support for Aging in Place, home and community based services (HCBS) could reduce overall aging expenditures, and how different states handled the process.